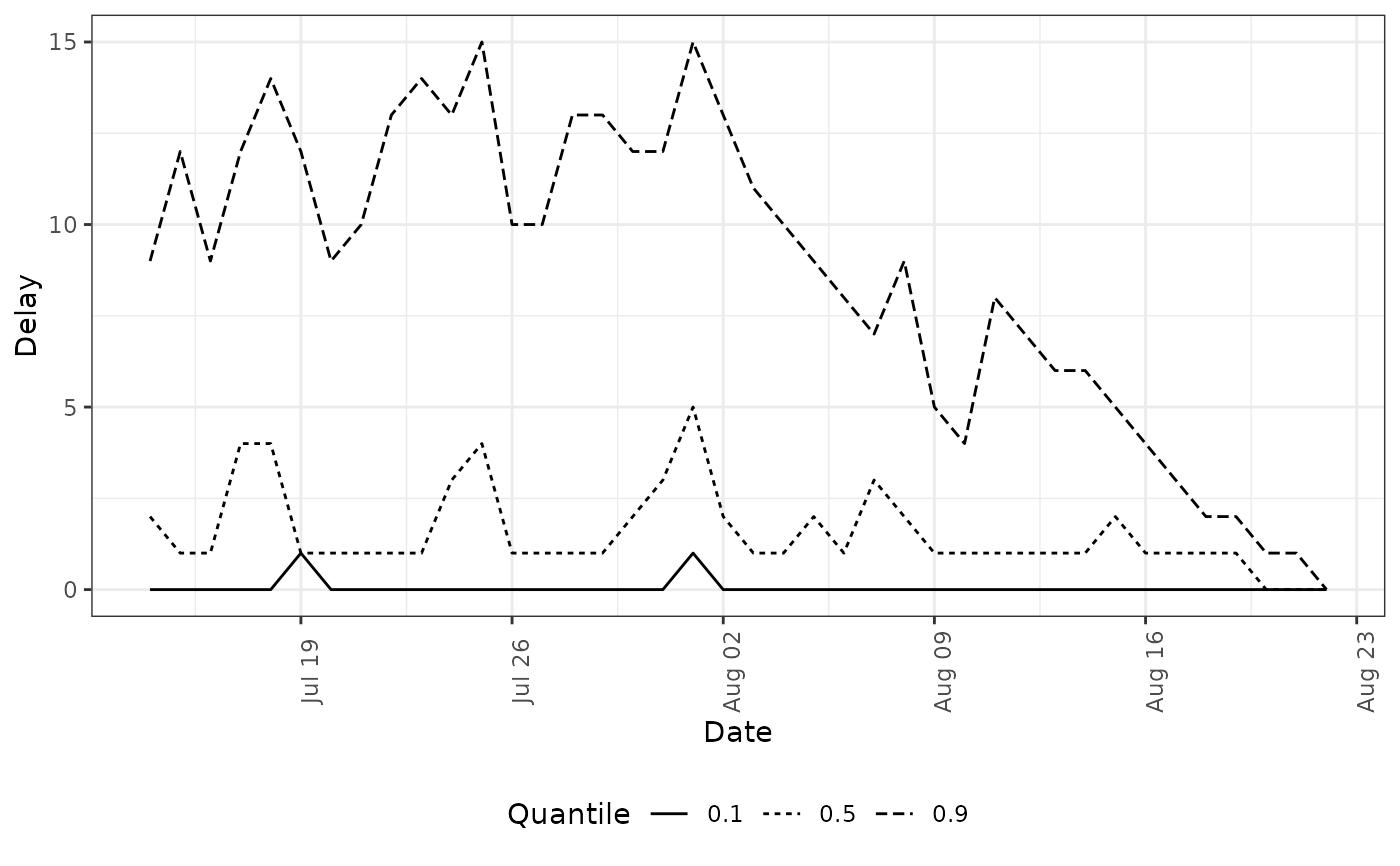
Line plot showing quantiles of the empirical delay distribution over reference dates.
Usage
enw_plot_delay_quantiles(pobs, quantiles = c(0.1, 0.5, 0.9), facet = TRUE)Arguments
- pobs
A preprocessed data object as produced by
enw_preprocess_data().- quantiles
A numeric vector of probabilities. Defaults to
c(0.1, 0.5, 0.9).- facet
Logical. When
TRUE(the default), plots with more than one.groupare automatically wrapped by group. Set toFALSEto disable and add a custom facet layer.
See also
Plotting functions
enw_delay_categories(),
enw_delay_quantiles(),
enw_plot_delay_counts(),
enw_plot_delay_cumulative(),
enw_plot_delay_fraction(),
enw_plot_nowcast_quantiles(),
enw_plot_obs(),
enw_plot_pp_quantiles(),
enw_plot_quantiles(),
enw_plot_theme(),
plot.enw_preprocess_data(),
plot.epinowcast()
Examples
pobs <- enw_example("preprocessed_observations")
enw_plot_delay_quantiles(pobs)