Generic quantile plot
Arguments
- obs
A
data.frameof summarised posterior estimates containing at least aconfirmcount column and a date variable- latest_obs
A
data.frameof observed data containing at least aconfirmcount variable and the same date variable as in the main data.frame used for plotting.- log
Logical, defaults to
FALSE. Should counts be plot on the log scale.- ...
Additional arguments passed to
ggplot2::aes()must at least specify the x date variable.
See also
Plotting functions
enw_delay_categories(),
enw_delay_quantiles(),
enw_plot_delay_counts(),
enw_plot_delay_cumulative(),
enw_plot_delay_fraction(),
enw_plot_delay_quantiles(),
enw_plot_nowcast_quantiles(),
enw_plot_pp_quantiles(),
enw_plot_quantiles(),
enw_plot_theme(),
plot.enw_preprocess_data(),
plot.epinowcast()
Examples
nowcast <- enw_example("nowcast")
obs <- enw_example("obs")
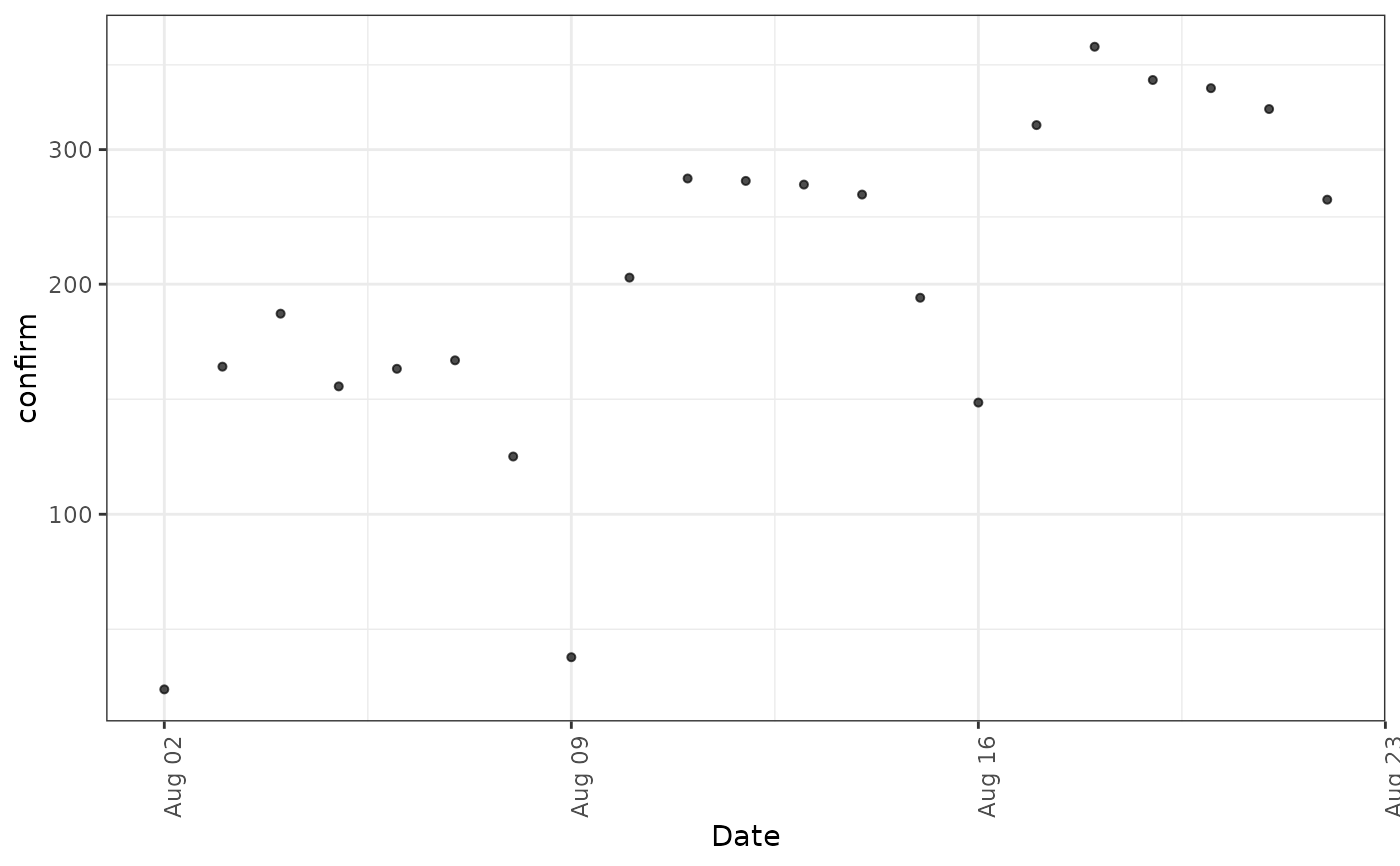
# Plot observed data by reference date
enw_plot_obs(obs, x = reference_date)
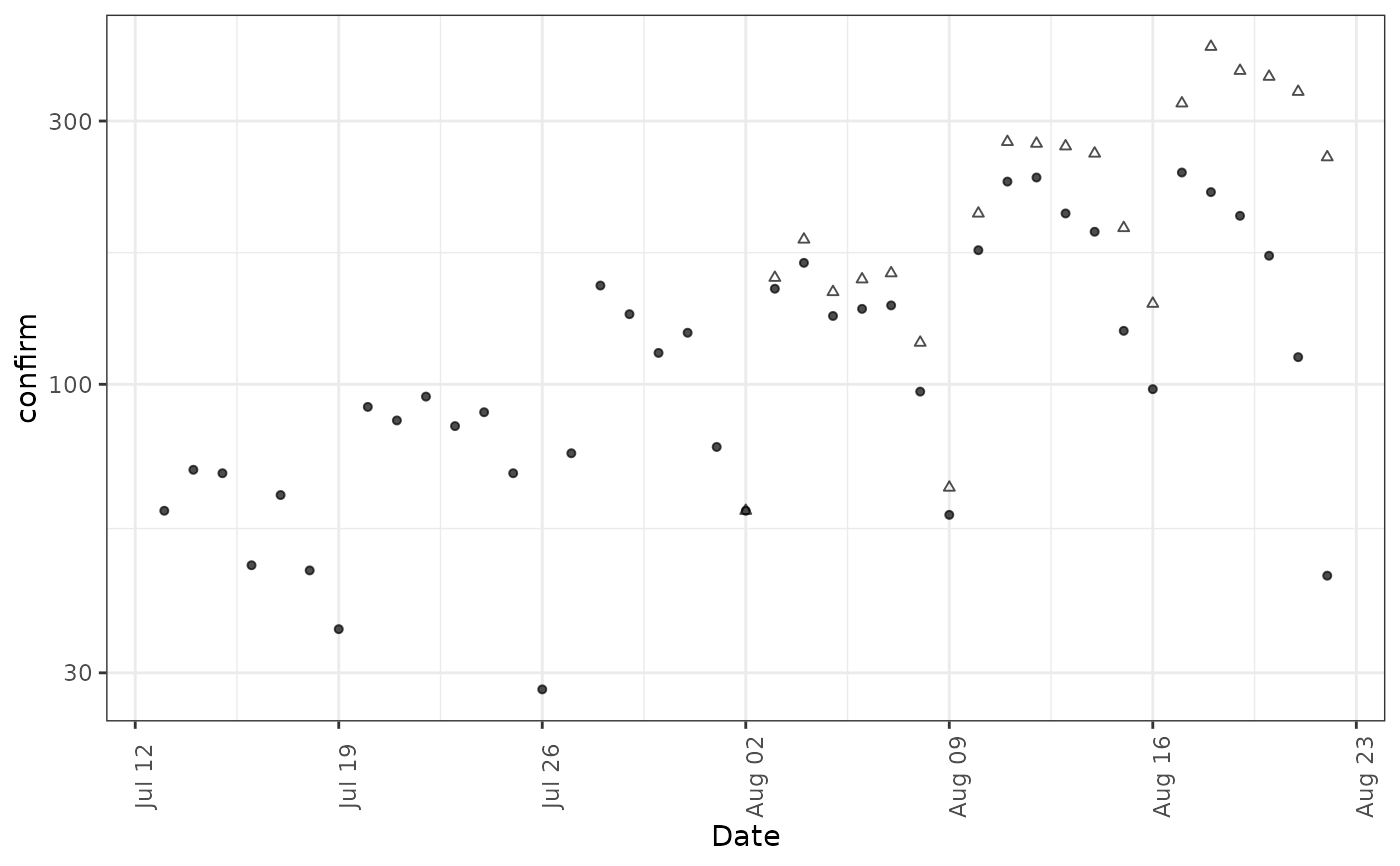
 # Plot observed data by reference date with more recent data
enw_plot_obs(nowcast$latest[[1]], obs, x = reference_date)
# Plot observed data by reference date with more recent data
enw_plot_obs(nowcast$latest[[1]], obs, x = reference_date)