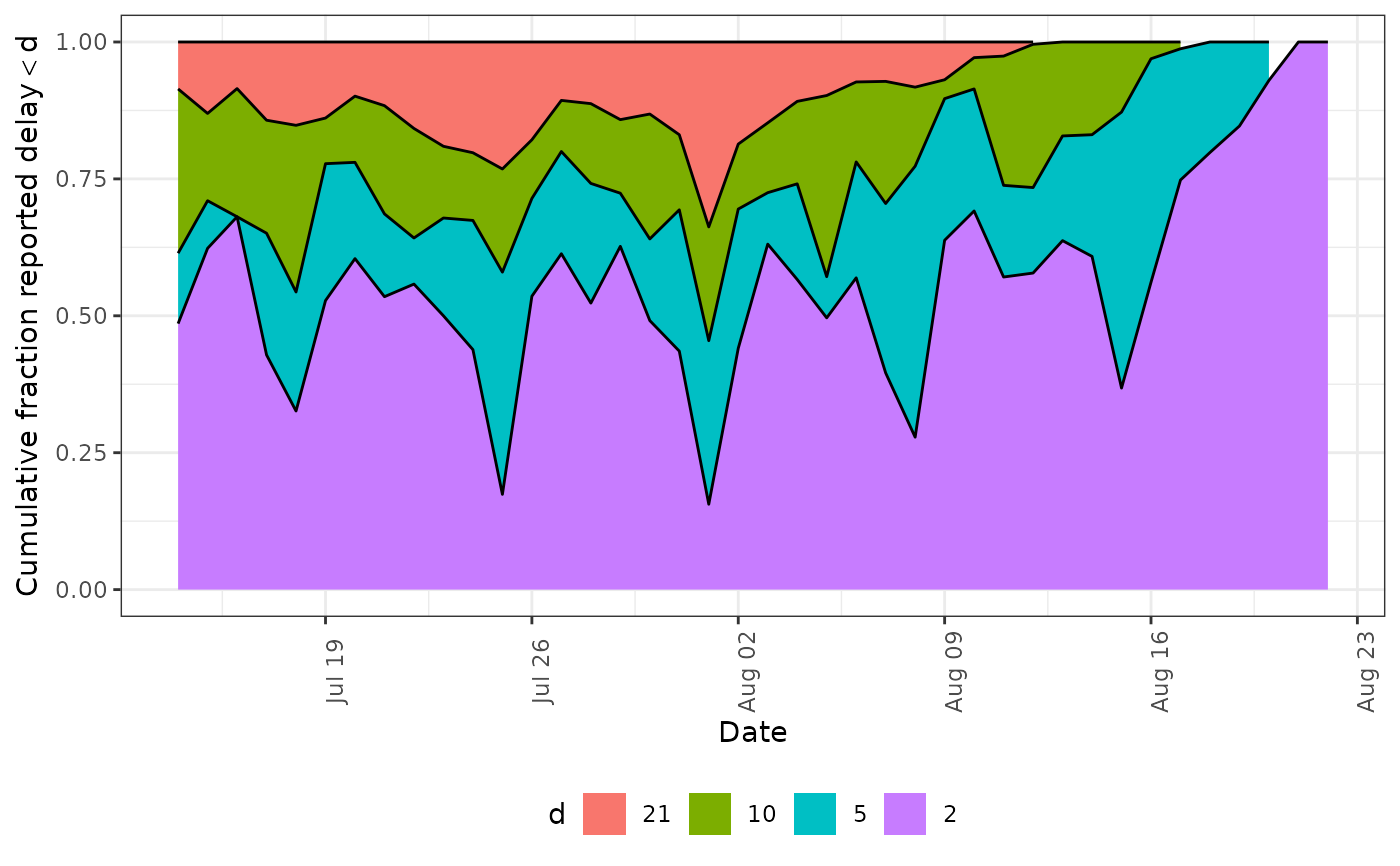
Stacked ribbon plot showing the cumulative fraction reported by delay group over reference dates.
Arguments
- pobs
A preprocessed data object as produced by
enw_preprocess_data().- delay_group_thresh
A numeric vector defining left-closed interval thresholds for delay groups.
- facet
Logical. When
TRUE(the default), plots with more than one.groupare automatically wrapped by group. Set toFALSEto disable and add a custom facet layer.
See also
Plotting functions
enw_delay_categories(),
enw_delay_quantiles(),
enw_plot_delay_counts(),
enw_plot_delay_fraction(),
enw_plot_delay_quantiles(),
enw_plot_nowcast_quantiles(),
enw_plot_obs(),
enw_plot_pp_quantiles(),
enw_plot_quantiles(),
enw_plot_theme(),
plot.enw_preprocess_data(),
plot.epinowcast()
Examples
pobs <- enw_example("preprocessed_observations")
enw_plot_delay_cumulative(pobs, c(0, 2, 5, 10, 21))