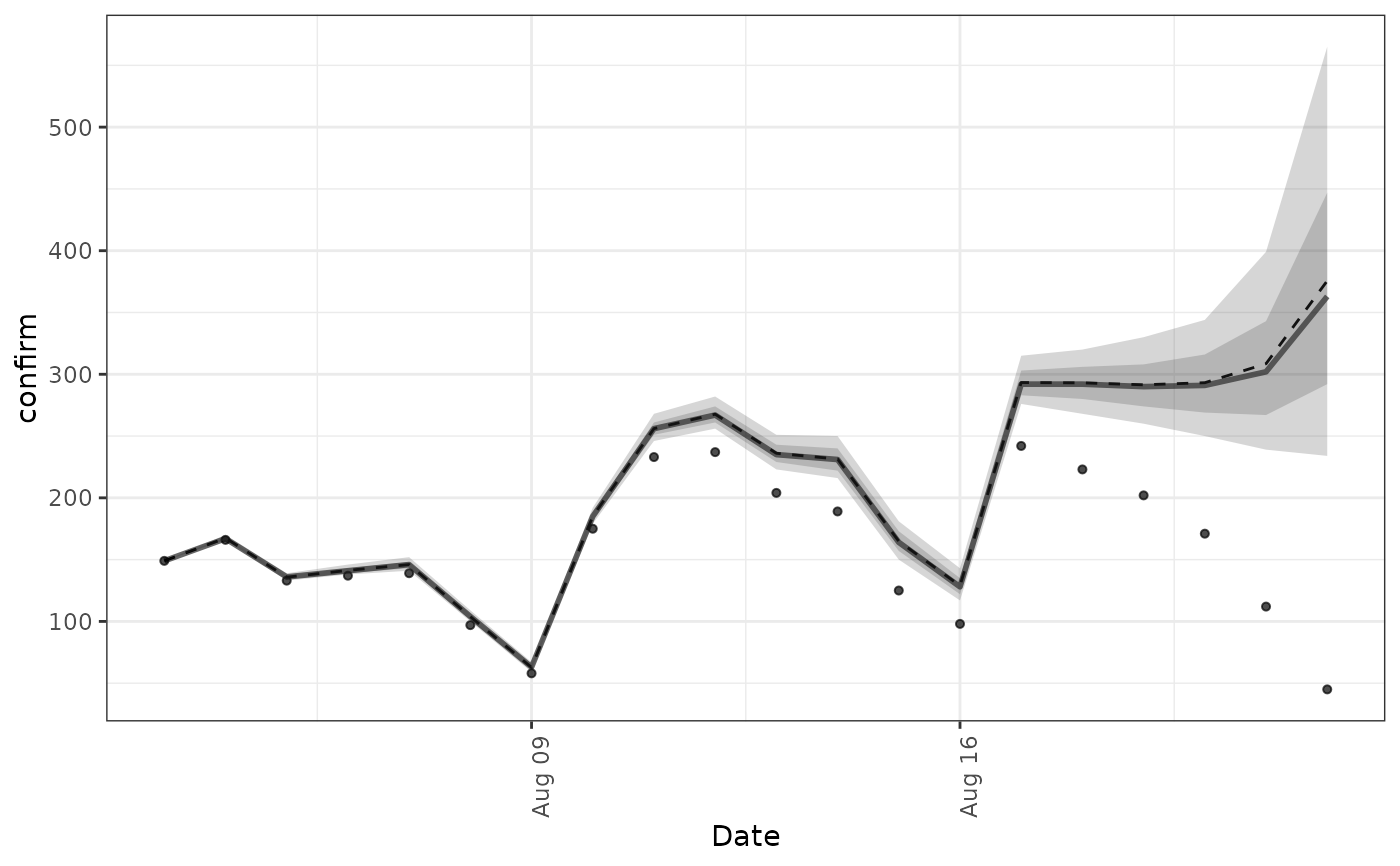
Generic quantile plot
Arguments
- posterior
A
data.frameof summarised posterior estimates containing at least aconfirmcount column a date variable, quantile estimates for the 5%, 20%, 80%, and 95% quantiles and the mean and median. This function is wrapped inenw_plot_nowcast_quantiles()andenw_plot_pp_quantiles()with sensible default labels.- latest_obs
A
data.frameof observed data containing at least aconfirmcount variable and the same date variable as in the main data.frame used for plotting.- log
Logical, defaults to
FALSE. Should counts be plot on the log scale.- ...
Additional arguments passed to
ggplot2::aes()must at least specify the x date variable.
Examples
nowcast <- enw_example("nowcast")
nowcast <- summary(nowcast, probs = c(0.05, 0.2, 0.8, 0.95))
enw_plot_quantiles(nowcast, x = reference_date)

