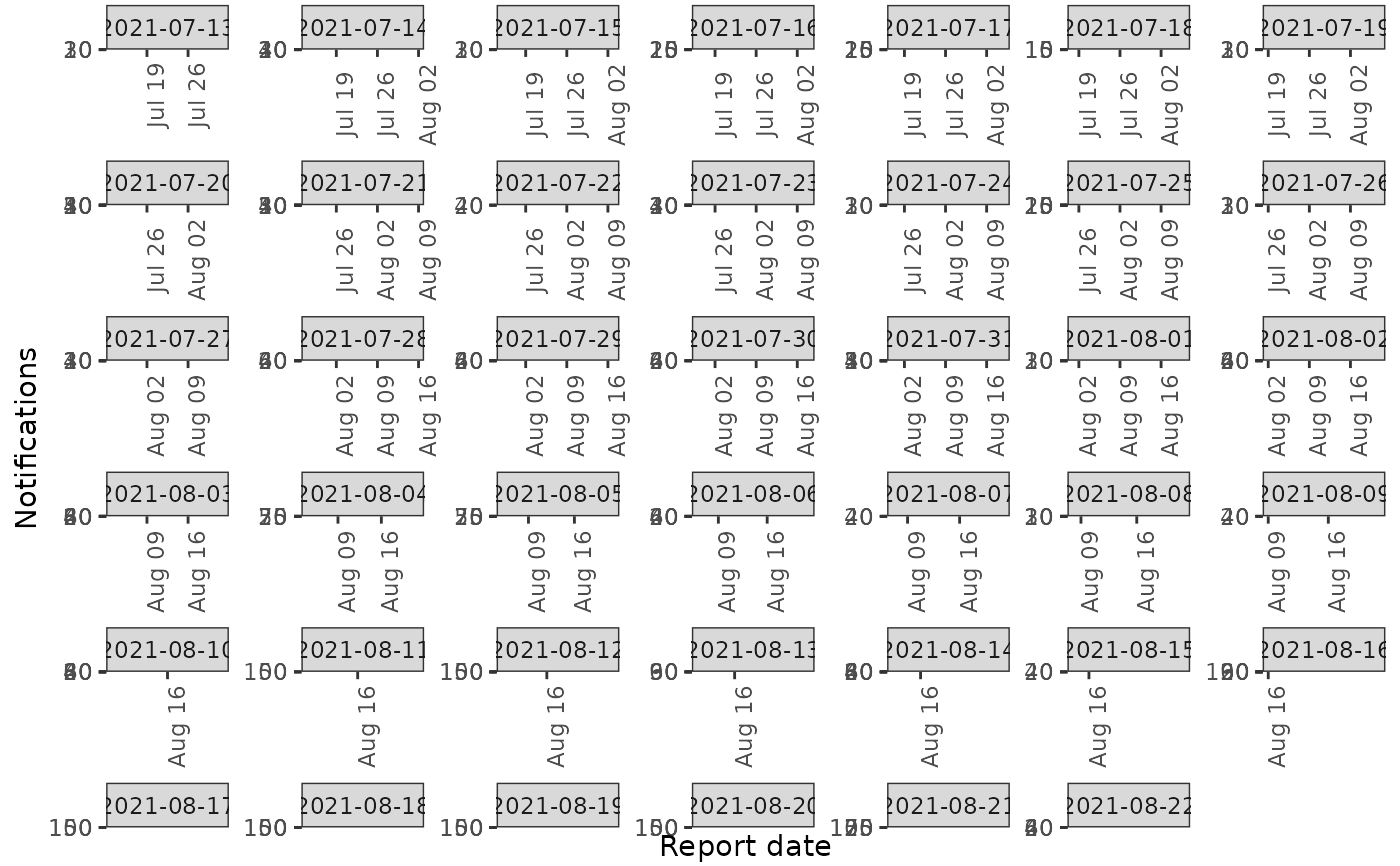
Plot posterior prediction quantiles
See also
Plotting functions
enw_delay_categories(),
enw_delay_quantiles(),
enw_plot_delay_counts(),
enw_plot_delay_cumulative(),
enw_plot_delay_fraction(),
enw_plot_delay_quantiles(),
enw_plot_nowcast_quantiles(),
enw_plot_obs(),
enw_plot_quantiles(),
enw_plot_theme(),
plot.enw_preprocess_data(),
plot.epinowcast()
Examples
nowcast <- enw_example("nowcast")
nowcast <- summary(
 nowcast, type = "posterior_prediction", probs = c(0.05, 0.2, 0.8, 0.95)
)
enw_plot_pp_quantiles(nowcast) +
 ggplot2::facet_wrap(ggplot2::vars(reference_date), scales = "free")
#> `geom_line()`: Each group consists of only one observation.
#> ℹ Do you need to adjust the group aesthetic?
#> `geom_line()`: Each group consists of only one observation.
#> ℹ Do you need to adjust the group aesthetic?